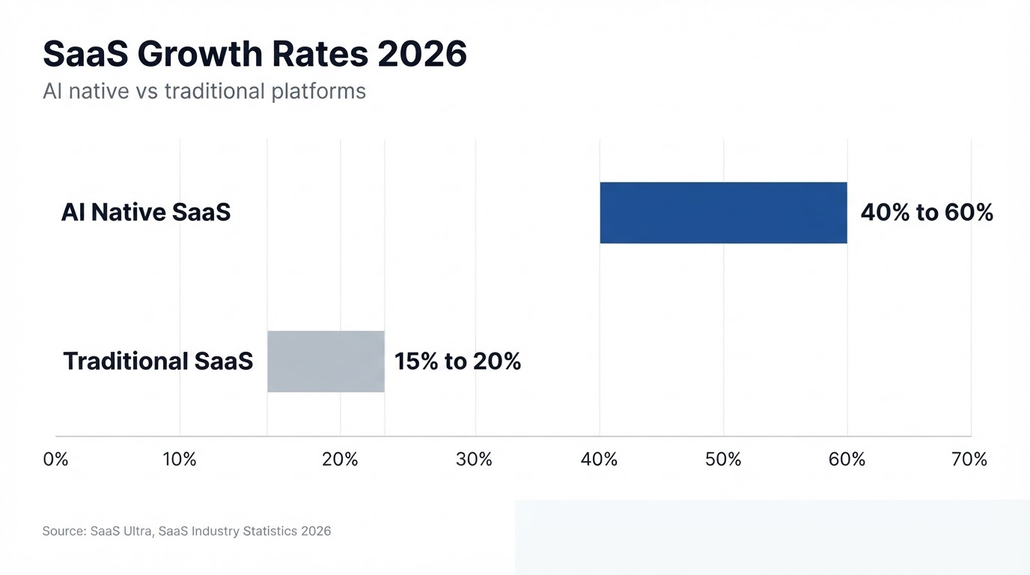
The global SaaS market isn’t just expanding in 2026. It is bifurcating. AI-native platforms are compounding at 40% to 60% annually while traditional platforms grow at 15% to 20%, with an overall median near 26%. Marketing budgets remain stuck at a median 8% of ARR. Buyers are simultaneously consolidating tools in some categories and flooding others with AI-powered applications, creating a more demanding, cost-sensitive environment for every vendor.
SaaSUltra’s compilation of more than 60 verified data points captures this restructuring. The numbers show a market where growth premiums are real but increasingly tied to deep AI integration, retention discipline, and the ability to prove measurable outcomes rather than simply adding seats.
Market Size and the Definition Problem
Estimates of the 2026 global SaaS market range from roughly $375 billion (Fortune Business Insights, narrower definition) to $465 billion (Precedence Research) and as high as $530 billion (Grand View Research). Mordor Intelligence places the broader SaaS market near $435 billion and projects nearly $977 billion by 2031 at a 17.55% CAGR. Gartner’s wider software spending forecast reaches approximately $1.46–1.47 trillion in 2026, reflecting 15%+ growth that includes licenses, infrastructure software, and AI-related spend beyond pure SaaS.
The spread is not noise. It reflects differing treatments of vertical platforms, AI-native tools, usage-based revenue, and hybrid deployments. North America still accounts for roughly 42–47% of the market, while Asia-Pacific is the fastest-growing region. Long-range forecasts converge on multi-trillion-dollar territory by the early-to-mid 2030s, but the near-term story is the divergence in growth rates inside the category.
The AI-Native Growth Premium—and Its Limits
AI-native SaaS companies (those for which AI is core to the product rather than a bolted-on feature) are growing 40% to 60% per year according to aggregated benchmarks from SaaSHero, Baremetrics, Vena Solutions, and others. Traditional platforms sit at 15–20%. Some datasets show even sharper gaps: top-quartile AI-native companies in the $1–20 million ARR band have recorded growth exceeding 200% in certain periods, while AI-enabled (not AI-native) software has flattened or declined relative to non-AI peers in some analyses.
The AI SaaS market itself is expanding at a reported 38%+ CAGR, rising from roughly $72 billion in 2023 toward multi-hundred-billion figures later in the decade. Over 80% of companies now run AI-enabled applications, up from about 5% in 2023 (Vena Solutions). Zylo data shows AI-native application spend rising 108% year-over-year overall and as much as 393% among large enterprises.
This premium is not free. Some ChartMogul-linked analyses indicate AI-native products can exhibit weaker net revenue retention (sometimes closer to B2C levels) because rapid adoption is followed by higher churn once novelty fades or usage costs become visible. Gross margins are also structurally lower—often 20–40 points below classic SaaS—because of inference and model-hosting costs. The winners are those that embed AI deeply enough to expand usage and retention, not those that simply add a chatbot.
Flat Marketing Budgets Meet Rising Buyer Scrutiny
The median private B2B SaaS company spends 8% of ARR on marketing, according to SaaS Capital’s 2026 survey of more than 1,000 companies. That figure is unchanged year-over-year. Sales is a separate line item, typically around 15% of ARR. Combined go-to-market spend is higher, but pure marketing budgets have not expanded even as competition intensifies.
On the buyer side, the average organization spends $55.7 million annually on SaaS, up 8% (Zylo 2026 SaaS Management Index). Median spend per employee sits near $9,500. License waste remains substantial—often in the high tens of millions per organization—while shadow IT and expense-based AI purchases (ChatGPT frequently tops expense reports) reduce visibility. Zylo and other surveys show 66–78% of IT leaders encountering unexpected charges tied to AI or consumption models in the prior year. These surprise bills make renewals more rigorous and new purchases slower.
Content remains one of the few levers that can stretch a flat budget. Position Digital data indicates 88% of marketers see positive results from proprietary research, and 64% report that data-led content converts better. Original, sourced numbers earn citations from journalists, buyers, and AI systems alike—precisely when paid acquisition is constrained.
Churn, Retention, and the Rule of 40
Median annual revenue churn sits near 12%, with best-in-class companies below 5% (Noizz.io and related benchmarks). Median B2B monthly logo churn is approximately 3.5%, of which roughly 0.8% is involuntary (failed payments). Segment differences are large: SMB-focused products often see double-digit annual logo churn, while enterprise can stay in the low single digits. Net revenue retention (NRR) is the clearer health metric; medians typically land in the low-to-mid 100s, with top-quartile companies well above 120%.
Only about 30% of public SaaS companies clear the Rule of 40 (growth rate plus profit margin exceeding 40%). Retention improves both sides of that equation.
A 1-percentage-point reduction in gross revenue churn can, in some analyses, produce a double-digit valuation uplift. Automated retries and dunning recover a meaningful share of the involuntary portion without new acquisition spend.
Pricing Shifts, Stack Dynamics, and Buyer Behavior
Vendors are moving away from pure per-seat models toward usage-based, credit-based, and outcome-based pricing. Roughly 62% of platforms offer AI premium tiers (McKinsey-linked data), and buyers often budget 25–35% more when AI is included. Gartner and others expect a substantial share of SaaS spend to shift to usage, agent, or outcome models by 2030.
After years of consolidation, the average number of applications per organization is rising again—up 11% year over year, according to BetterCloud’s 2026 State of SaaS report—driven by AI. Organizations now deploy an average of about 27 AI-powered SaaS apps (roughly 22% of the portfolio). Mid-market companies saw especially sharp increases. Only about half of apps carry formal IT approval in some surveys, creating governance and cost-control challenges. By 2026, the large majority of business applications are expected to be SaaS-based, making most purchase decisions renewals rather than first-time buys.
FAQ
How big is the SaaS market in 2026?
Between $344 billion and $465 billion. Gartner gives the narrow figure. Precedence Research gives the broad one. The gap comes from how each defines SaaS.
How fast are AI native SaaS companies growing?
AI native SaaS grows 40% to 60% a year. Traditional SaaS grows 15% to 20%. The overall median is about 26%.
How much do SaaS companies spend on marketing?
The median is 8% of ARR, according to SaaS Capital. That share did not change from the prior year.
What is a good SaaS churn rate?
Median annual revenue churn is 12%. Best in class is under 5%. Median B2B monthly logo churn is 3.5%.