The Inspired Culture™ — Where Leadership Becomes Legacy™
Engaged employees show up. Inspired employees stay.
Why this matters: Engagement has barely moved in years: about one in three U.S. employees and one in five worldwide. Meanwhile, turnover can cost a 500-person organization as much as $12 million a year. Inspired Culture results show what happens when you go beyond engagement: turnover down 40–50% in one year, a workforce that rates above best-practice engagement on productivity, and the top customer service ranking in a national network. Here is how.
Engagement is the foundation
For decades, Gallup’s research has shown that engaged employees drive better results: lower turnover, fewer safety incidents, higher productivity and stronger customer loyalty. That body of work made engagement the standard every serious organization measures, and it remains the foundation of a healthy workplace.
The best organizations in Gallup’s database reach about 70% engagement, compared with about 31% across the U.S. and 20% worldwide. Getting there is a real achievement.
Research also shows there is a level beyond it.
The level beyond engagement
Bain & Company research, published in Harvard Business Review, compared the productivity of employees at different levels of commitment. Setting a satisfied employee at 100, an engaged employee produced 144 and an inspired employee produced 225, more than twice the satisfied level and over 50% more than engaged.
The researchers found that inspiration comes from finding meaning in the organization’s mission and from leaders who inspire. Those are experiences that reach beyond the immediate team, and they can be developed.
| Level | What it looks like | Relative productivity (Bain) |
|---|---|---|
| Satisfied | Content with the job; does what is asked | 100 |
| Engaged | Committed, enthusiastic, connected to the team and supervisor | 144 |
| Inspired | Engaged, and also draws meaning from the mission, trusts leadership and sees a future | 225 |
Bain & Company research with the Economist Intelligence Unit, published in Harvard Business Review in 2015. The index reflects senior executives’ assessments of relative productivity, not measured output.
The Inspired Culture™ exists to help organizations build on engagement and reach that third level.
Inspired employees stay: the evidence
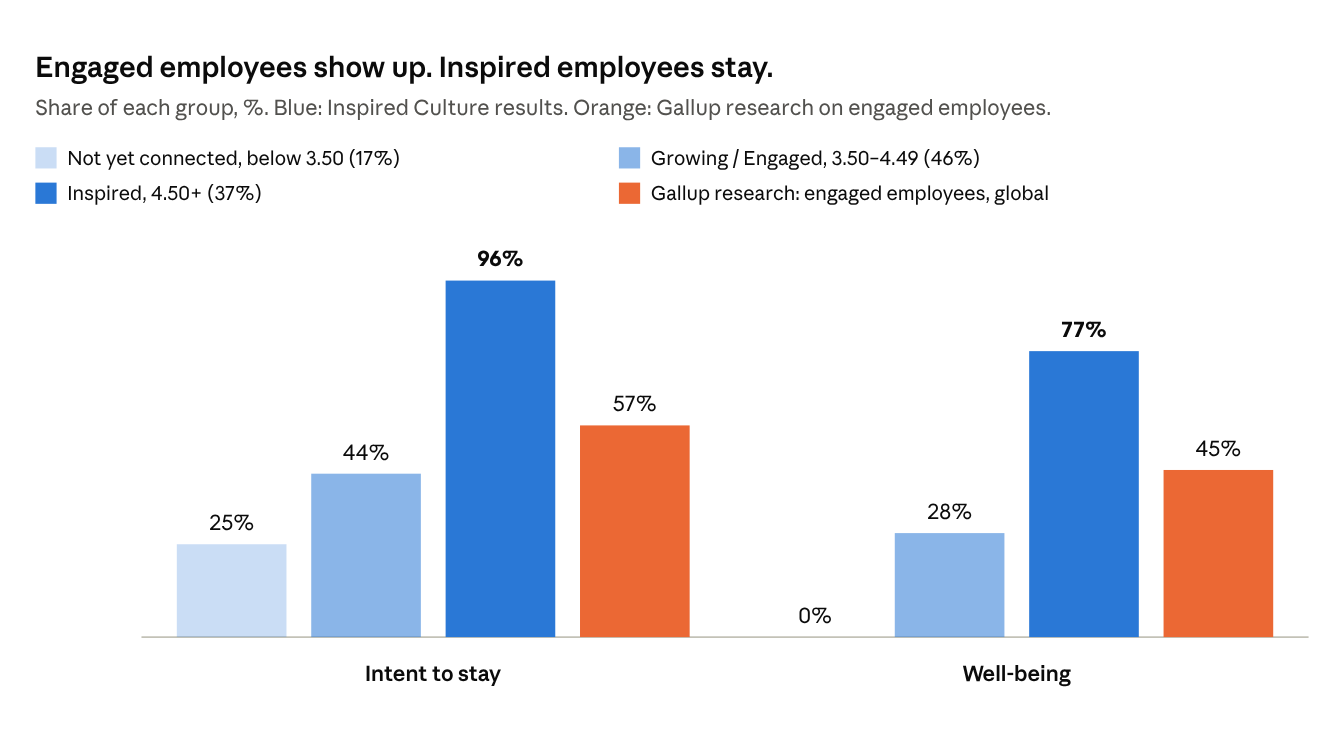
Inspired Culture results show the pattern behind our headline. Employees were grouped by their average across the 12 culture questions, leaving out the two outcome questions (intention to stay and well-being), and the outcomes for each group were then compared.
| Employee group | Share of employees | Intent to stay | Well-being | Average voice score |
|---|---|---|---|---|
| Inspired (4.50+) | 37% | 96% strongly intend to stay | 77% strongly satisfied | 4.85 |
| Growing / Engaged (3.50–4.49) | 46% | 44% strongly intend to stay | 28% strongly satisfied | 4.03 |
| Not yet connected (below 3.50) | 17% | 25% strongly intend to stay | 0% strongly satisfied | 2.08 |
| Gallup research: engaged employees, global | 20% of employees worldwide | 57% not watching for or seeking a new job | 45% thriving in their lives | Not measured |
Inspired Culture results: one client engagement, 2026 survey (70 respondents). Gallup: State of the Global Workplace 2023 (job seeking) and Gallup global well-being research (thriving)
What this means. Moving an employee from Growing / Engaged to Inspired more than doubles the likelihood that they strongly intend to stay (44% to 96%) and nearly triples the likelihood that they are strongly satisfied with their well-being (28% to 77%). Engagement keeps people in their seats. Inspiration keeps them committed. That is why the Inspired Culture standard is 4.50, not simply a higher engagement score.
The Growing band corresponds to the engaged level in engagement research. Gallup figures describe engaged employees worldwide: 43% are watching for or actively seeking a new job, so 57% are not (State of the Global Workplace 2023), and 45% are thriving in their lives (Gallup global well-being research). Our measures are stricter, a 5 out of 5 on intent to stay and on satisfaction with well-being, so the comparison shows direction, not exact equivalence.
Inspired Culture results in practice
Inspired Culture results from a recent engagement with a multi-location service organization of about 85 employees, after the first program year:
- A 40–50% reduction in turnover
- More than a third of employees (37%) at the Inspired level, above U.S. and world engagement levels while being measured against a higher standard
- The top customer service ranking in the organization’s national network
When every level is scored on Bain’s productivity index, Inspired Culture results rate above the best-practice engagement average, and stay above it however conservatively the middle tier is counted.
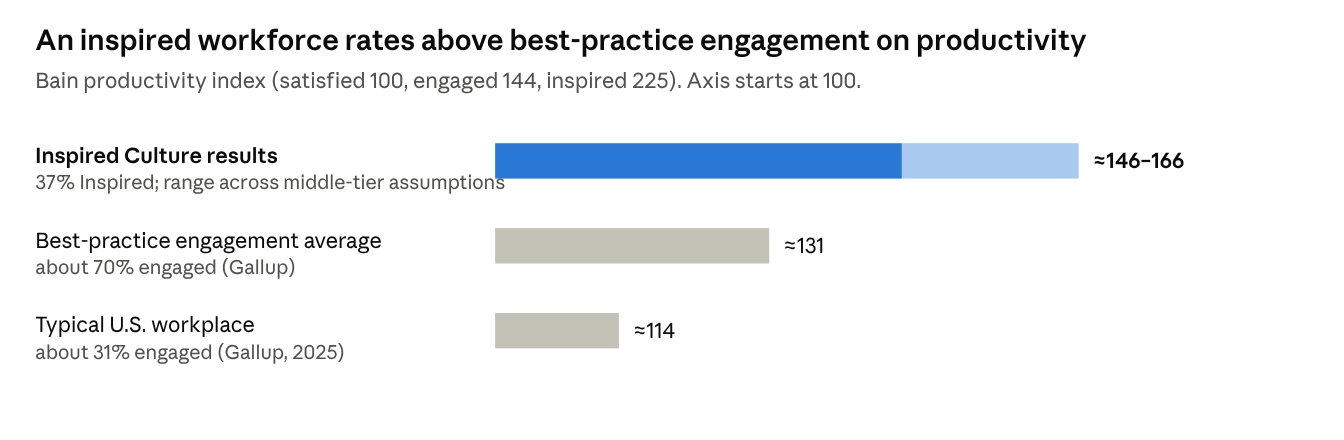
Inspired Culture results: one client engagement, 2026 survey. Bain & Company/HBR productivity index (2015) applied to Gallup engagement benchmarks
The two surveys use different instruments and have not been given to the same employees, so this comparison shows direction on Bain’s weighting rather than a head-to-head ranking.
What an inspired culture is worth
Decreased Turnover. Gallup estimates that replacing an employee can cost as much as two times their annual salary, and calls its range a conservative estimate. At that level, a 500-person organization with an average salary of $50,000 could be spending as much as $12 million a year on turnover. A 40–50% reduction in turnover could put up to $6 million a year back into the business.
Increased Productivity. On Bain’s productivity index, the workforce mix our approach has produced yields roughly 30–45% more than a typical U.S. workforce, and more than best-practice engagement levels.
Stronger Top and Bottom Line. Gallup’s meta-analysis of more than 180,000 teams found that top-quartile engaged teams achieve 23% higher profitability and 18% higher sales productivity than bottom-quartile teams. Inspired Culture results showed the same pattern in the first program year: the top service ranking in the organization’s national network and 90%+ completion of its business objectives, alongside the drop in turnover. Bain’s research suggests the gains from inspired employees are larger still.
| For a 500-person organization | Estimate |
|---|---|
| Annual cost of turnover | Up to $12M |
| Potential annual savings at a 40–50% reduction | Up to $6M |
| Productivity vs. a typical U.S. workforce (Bain index) | +30–45% |
| Profitability, top vs. bottom engagement quartile (Gallup) | +23% |
| Sales productivity, top vs. bottom engagement quartile (Gallup) | +18% |
Turnover estimates use the upper end of Gallup’s range (two times salary) with an average salary of $50,000; your organization’s figures will differ. Savings assume a reduction similar to Inspired Culture results.
What best-in-class organizations look like
The best workplaces in the world set a clear standard. Here is how they compare with the typical workplace, where Inspired Culture results stand today, and where an Inspired Culture aims.
| Measure | Typical U.S. workplace | Best in class | Inspired Culture results | Inspired Culture target |
|---|---|---|---|---|
| Positive employee experience | About 57% say it is a great place to work | 90–96% at the top Fortune 100 Best Companies to Work For | 84% favorable on overall job satisfaction and well-being; 78% average across the 12 culture questions | 90%+ |
| Engaged or higher | 31% | 70% at Gallup best-practice organizations | About 83% | 100% |
| • Inspired, beyond engaged | Not measured; engaged is the top tier | Not measured; engaged is the top tier | 37% | 90% within three years |
| • Engaged level | 31% engaged | 70% engaged | 46% (Growing band) | 10% |
| Turnover | About twice the certified-workplace rate | About 12% at Great Place to Work Certified companies | Down 40–50% in one year | 12% or less |
| Financial performance | Market average | Fortune 100 Best Companies have outperformed the market by nearly 4x over 26 years | Top service ranking in the organization’s national network | Culture tracked alongside business results |
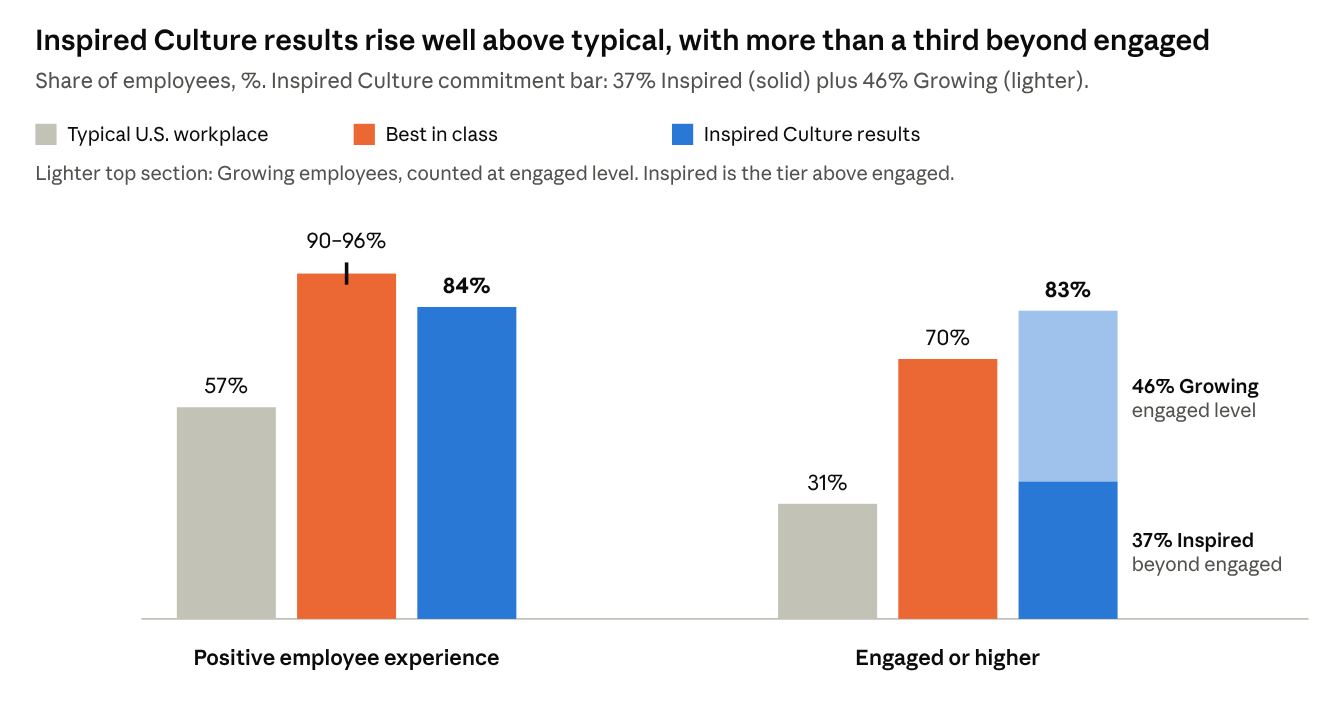
Inspired Culture results: one client engagement, 2026 survey. Benchmarks: Great Place To Work (2026 company profiles); Gallup State of the Global Workplace 2025
What they do differently:
- The experience is consistent for everyone, at every level and location, not just on the best teams.
- Managers are developed deliberately. Gallup finds managers account for about 70% of the difference in team engagement.
- People find meaning in the work. Great Place To Work’s research found meaning is a stronger reason to stay than training, promotions or pay.
- Culture is measured often and acted on visibly, so employees see their feedback lead to change.
Each of these practices is built into The Inspired Culture™ system: one leadership standard for every leader, weekly Inspired OS™ habits, connection to the mission through the H.E.A.R.T.™ Framework, and quarterly pulses with a “You Said, We Did” loop that answers every idea within 30 days.
Companies are named only as published list results; they are not clients and have not endorsed this material. Surveys differ, so comparisons show direction. Growing employees are counted at engaged level; counting only half of them, the Inspired Culture share would be about 60%. Sources: Great Place To Work, Certification and The Business Case for a High-Trust Culture; Gallup, Employee Engagement.
How we get you there
The Inspired Culture™ installs a culture operating system that leaders practice every week, in three steps:
- Assess. An independent Inspired Culture Survey and the H.E.A.R.T.™ diagnostic show where your culture stands, by location and pillar, and where your retention risk sits.
- Leaders first. Executives and managers start with 50 Masks of Leadership™ and the weekly Inspired Growth Scorecard™ in Inspired OS™, so employees see the standard modeled before they are asked to practice it.
- Sustain and spread. Habits reach the front line, every employee idea is answered within 30 days, and quarterly pulses track progress, so culture is managed continuously, not once a year.
Visible wins come in the first 30 days, and results show up in the first year. The full method is published in The Empty Chair (Eric Himes, 2026).
How we measure
The Inspired Culture Survey builds on the themes engagement research has established: clear direction, the tools to do the job, recognition, care, development, voice, connection to the mission, teamwork and growth. It then adds the experiences research links to inspiration: leadership vision, transparency from leadership above the supervisor, inspiration from the mission and values, inclusion and belonging, and a visible career path. These added items describe the wider organization and are typically the hardest to rate highly, so reaching the top tier is demanding.
Every item uses a 1–5 scale. Each employee’s level comes from their average across 12 culture questions; well-being and intention to stay are tracked separately as outcomes.
- Inspired: 4.50 and above
- Growing / Engaged: 3.50 to 4.49
- Not yet connected: below 3.50
The rule is simple and fully disclosed to every client, so leaders can see exactly how their people are classified.
About The Inspired Culture™
The Inspired Culture™ is a leadership development and culture consulting firm built on Faith + Science + Strategy. We help organizations and their people win on the fronts that matter most: professionally, personally, relationally and at home. Founder and President Eric Himes is the author of The Empty Chair, a member of Thought Leaders 100, a speaker, and the host of Inspired Culture TV.
Start with a free, confidential culture assessment
Find out where your culture stands today and what it would take to reach Inspired, at no cost and with no obligation.
What you receive:
- A snapshot of your culture across the five H.E.A.R.T.™ pillars
- Your share of Inspired, Growing / Engaged and not-yet-connected employees
- Your top retention risks and the experiences driving them
- A 30-minute readout with three priorities to act on first
Your people’s answers stay confidential. The survey is administered independently. Your organization receives results only as group averages, never individual responses, and no result is reported for any group smaller than five. Employees can answer honestly, which is what makes the results worth acting on.
Media Contact
Email info@yourpathinspired.com to schedule your assessment.
Gallup and Q12 are trademarks of Gallup, Inc. Fortune 100 Best Companies to Work For and Great Place To Work are trademarks of their respective owners. The Inspired Culture™ is not affiliated with any of these organizations, and none of them has reviewed or endorsed this comparison. Client turnover figures refer to voluntary turnover.
Sources: Gallup, Employee Engagement and State of the Global Workplace; Garton and Mankins, “Engaging Your Employees Is Good, but Don’t Stop There,” Harvard Business Review, 2015 (Bain & Company); Gallup, “This Fixable Problem Costs U.S. Businesses $1 Trillion” and Q12 Meta-Analysis; client survey and program data, 2024–2026.